It is more difficult to get a readers attention and therefore necessary to provide relevant information in a digestible format.
Our post on how to create an infographic advised to not go into much detail, but instead trigger curiosity for a subject. An effective infographic should focus on key takeaways and making the message memorable.
What are infographics?
An infographic is visually arranged data. An effective infographic can explain technical information and statistics in visually appealing pieces. Infographics should not need to be explained outside the graphic– keep them focused and concise.
How powerful are effective infographics?
Very. At least that’s what the below statistics by Market Domination Media (2014) show:
- An infographis is 30 times more likely to be read than a text article
- 90% of information transmitted to the brain is visual
- 93% of all human communication is nonverbal
- Publishers that feature infographics grow traffic 12% faster than those who don’t use infographics
[tweetthis]An #infographic is 30x more likely to be read than an article via @ninabres[/tweetthis]
However, simply combining any text and images on a page does not make an infographic. Infographics will strategically sort ideas, similar to a well-thought article that guides viewer through the presented information.
5 Examples of Effective Infographics
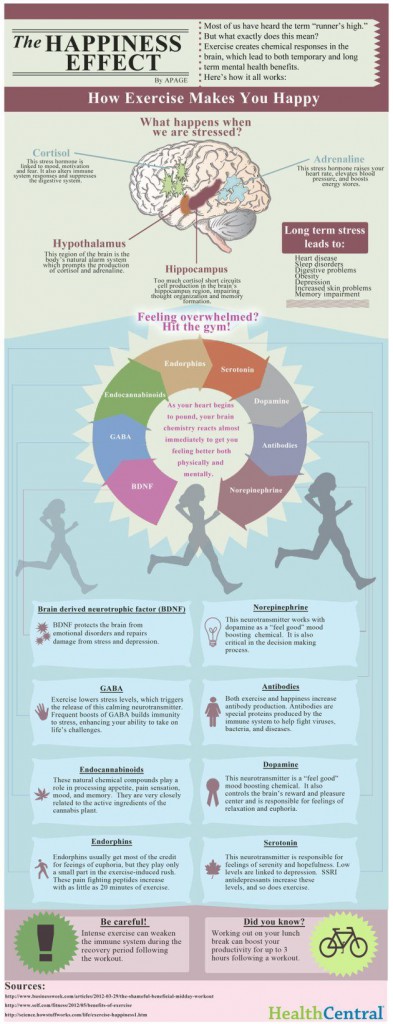
1. Illustrate Processes
Infographics can illustrate processes, cause-and-effect, concept maps, instructions, timelines and many other organized information that needs to be explained. The below example by Health Central explains how exercise creates a "happiness effect." The graphics make this phenomena easier to understand than reading through an article with the same information.
2. Visualize Statistics
Sometimes infographics present statistics of the same topic that are not directly related and don't need to be displayed in a particular order. The below infographic shows various statistics related to the outcomes of volunteering along with simple graphical elements. It contains a good amount of text and is divided between two sub-topics: Benefits for the individual and benefits for the employer.

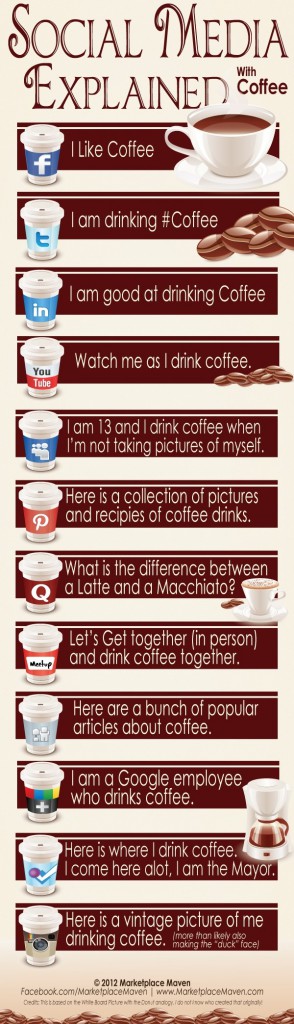
3. Entertain
It all comes down to making information visually appealing. People tend to connect with emotions, and humorous infographics can make it easier to remember the information. The below infographic creatively combines two unrelated subjects to explain social media channels – though it probably wouldn't make much sense if you are not familiar with these channels. Instead, the purpose might be to entertain those already familiar with social media networks.
Plus, doesn't coffee help explain anything?
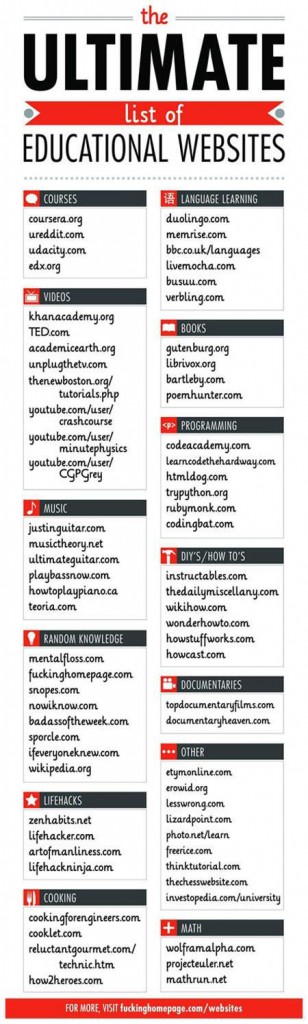
4. Compile Lists
Infographics don't necessarily need a complicated layout and design concept – if it includes useful information, a simple and clean layout may even be more powerful. The below infographic on educational websites does not have many visuals, but instead more copy than images. Having this list in the form of an infographic makes it easy to save and revisit as needed.
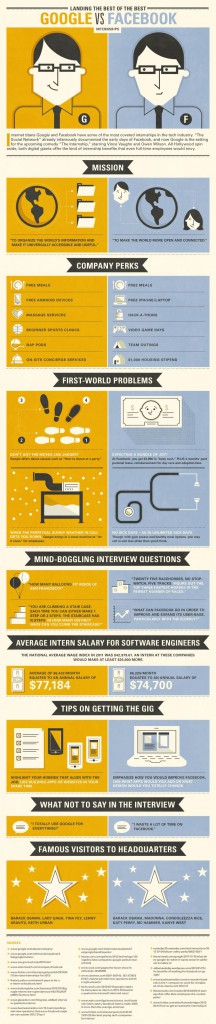
5. Compare & Contrast
Another powerful use of Infographics is for comparison purposes. If you need to compare two or more factors or present the differences among various products, an infographic provides the opportunity to lineup the features of each option along with visuals. This example compares the benefits of Google and Facebook internships.
While these are common uses of effective infographics, don't limit yourself to these. Infographics can also visualize lists, tell a story, show a brand, and much more. Infographics offer the chance to be creative and think outside the box – ask yourself how your message will be memorable to the reader.
If you have created an infographic in the past, would you mind sharing it in the comments?