
![]() New technologies have been beneficial to humanity throughout history: the sextant, the printing press, semiconductor electronics, the Internet, toasters....
New technologies have been beneficial to humanity throughout history: the sextant, the printing press, semiconductor electronics, the Internet, toasters....
Currently, an open-source technology is aiding researchers examining structures emerging in Twitter conversations.
Last week we looked at those six social media conversation structures–some looking like a cell dividing–resulting from a groundbreaking study conducted by the Pew Research Center and the Social Media Research Foundation.
Now, we'll we dig into how the method for mapping the social media landscape was conducted.
(I imagine the researchers looked like this during the project)
Network mapping the social media landscape
[Tweet ""A map does not just chart, it unlocks and formulates meaning; it forms bridges between here and there." ― Reif Larsen, The Selected Works of T.S. Spivet."]
 Just as a topographic map details cultural and natural features of our physical world, NodeXL allowed the project's researchers to graphically represent the social media landscape.
From the data on Twitter conversations and communities the researchers collected, NodeXL generated network visualization maps along with reports that "highlighted key people, groups, and topics in the social media discussions." Sounds like a potentially rough go for researchers to sift through the millions of conversations they collected, huh?
NOT SO FAST, MY FRIEND! NodeXL let them take their Excel data, click a button (like this?), and it spit out the network graph like ¡voila!
How NodeXL draws a Twitter social media network map
- NodeXL's Twitter data importer collects tweets that contain your chosen keywords or hashtags.
- The collection of Tweets containing the keywords or hashtag is sifted through to find connections formed when one user mentions or replies to another user.
- NodeXL uses an algorithm to automatically analyze the network and constructed groups created when each person in the collection is placed in a group based on how densely people tweeting about the topic were connected to each other.
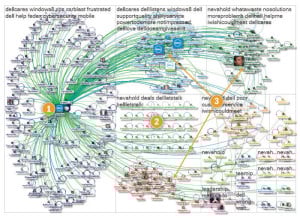
- The social network map is created using profile photos, groups displayed in boxes, and lines drawn among the people who link to each other either by interacting with each other (following, replying to, or mentioning).
Breaking down the pieces of a network map
 Click to enlarge
Upon first look, a social media network map could be hard to understand. Here are the key pieces of a map to identify:
- Boxes: separate boxes are labeled by the top hashtags used in the tweets from the users in each group.
- Pictures/Icons: each Twitter user who posted on this subject in the time period is represented by their profile picture. The bigger the picture, the more followers the Twitter user has.
- Bridges: Twitter users who have followers in multiple groups and share information between those groups are connected by bridges.
- Edge/Line: lines represents links between two Twitter users who follow, reply to, or mention one another.
- Groups and density: Twitter users who follow, mention, or reply to one another bunch together. The thicker/denser the group, the more people inside it are connected to each other and the less connected they are to people outside their group.
- Hubs: the closer a picture is to the center of a group, the more connected that user is to other group members (i.e. “influencers”).
- Circles: represent isolated tweets that do not mention or reply to another Twitter user.
- Isolates and small groups: relatively unconnected Twitter users ("outsiders") tweeting about a subject but aren’t connected to others in the large groups discussing the same topic.
What this means
The social media network maps produced by NodeXL afford us to graphically depict structures emerging from conversations taking place in cyberspace.
We can observe these conversation systems and NodeXL allows one to zoom in and zoom out of these structures to create situational awarenesses on a variety of discussions (political, hobby, sport, etc.). Reggie Watts offers a more detailed and accurate description applicable to the purpose of this study.
The freedom of use for interested people to use NodeXL to examine their own Twitter networks can have great implications for the future of social media research.
In what other ways do you think this software could be used?
